
Use Case · C&I
Demand Charge Management
Reduce peak demand costs with intelligent battery energy storage.
- 200 kW
- Peak reduction
- $48k/yr
- Demand savings
- 3.3 yr
- Simple payback
Outcomes
What this solution delivers.
Lower monthly demand charges
Discharge into the short peaks that set your billed demand.
No operational change
The EMS shaves peaks automatically — the facility runs exactly as before.
Forecast-aware dispatch
A reserved state-of-charge floor protects against back-to-back peaks.
Problem
Why this matters.
Utilities bill demand on your single highest 15–30 minute interval each month — often set by a compressor start, a batch process, or an EV-charger bank that runs only minutes a day. Those rare peaks can dominate the bill even though the facility rarely draws that much power.
Demand charges bill you for your single highest 15–30 minute interval each month — often set by a compressor start, a batch process, or an EV-charger bank that runs only minutes a day. Capacity you rarely use can dominate the bill. Navvion's EMS reads site demand in real time and discharges the battery just as load approaches the monthly threshold, then recharges off-peak — trimming the billed peak without touching production.
Navvion Approach
How we deliver results.
Architecture
How the system fits together.
The battery connects at the main switchboard, behind the utility meter. The EMS reads site demand in real time and discharges whenever load approaches the monthly peak threshold, then recharges in off-peak windows — no change to how the facility operates.
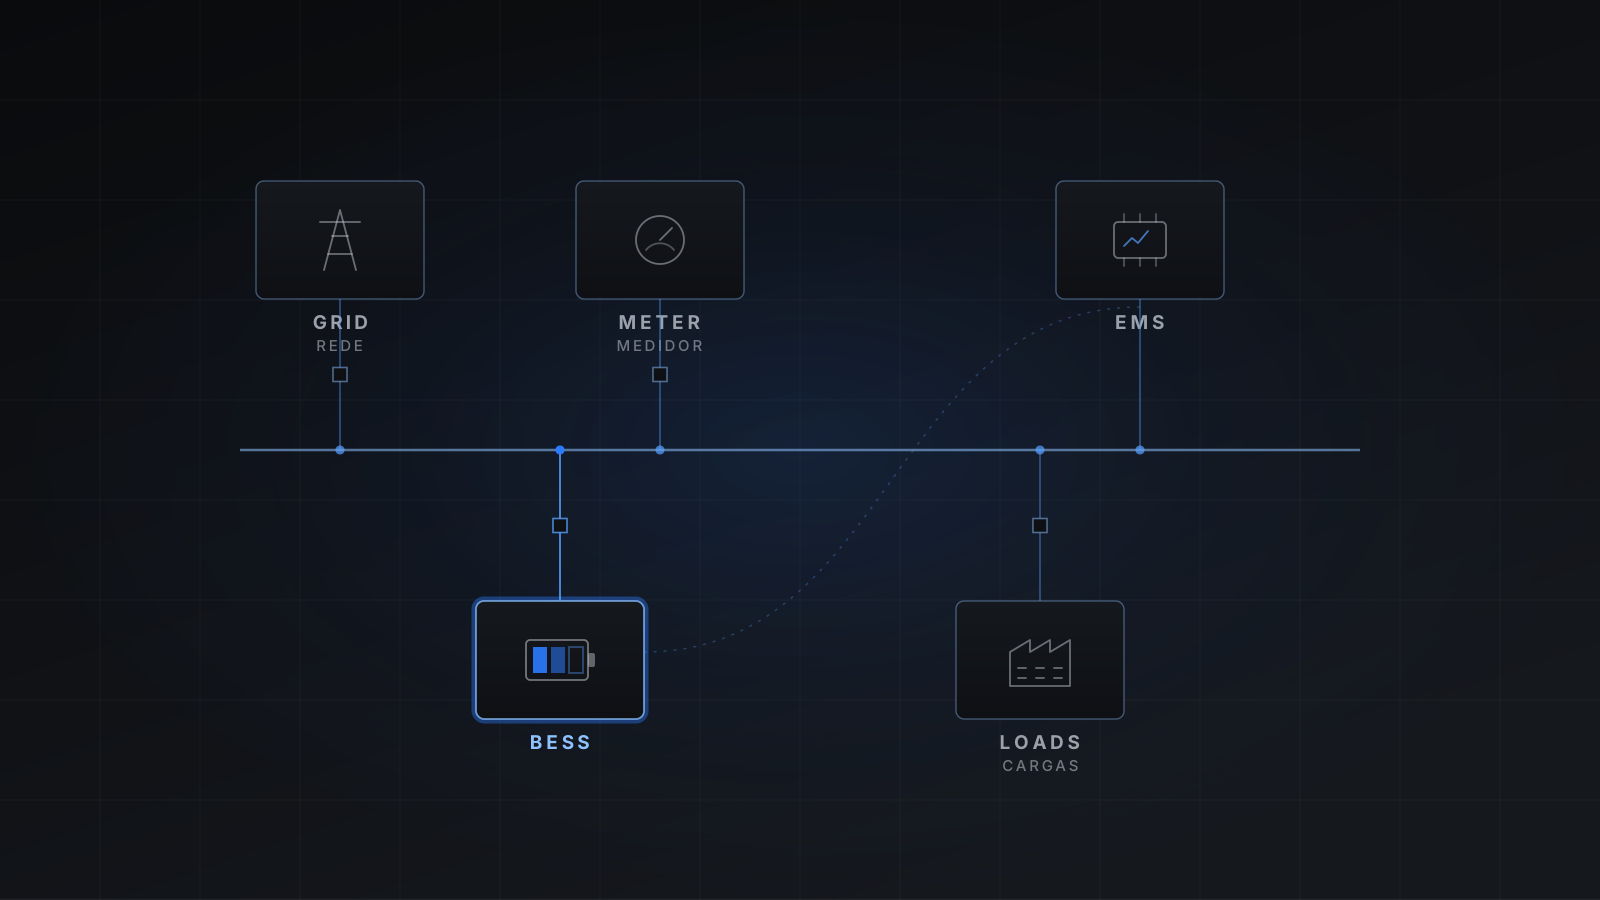
Simplified one-line diagram. Final architecture is engineered per site.
Products Used
Navvion systems for this solution.
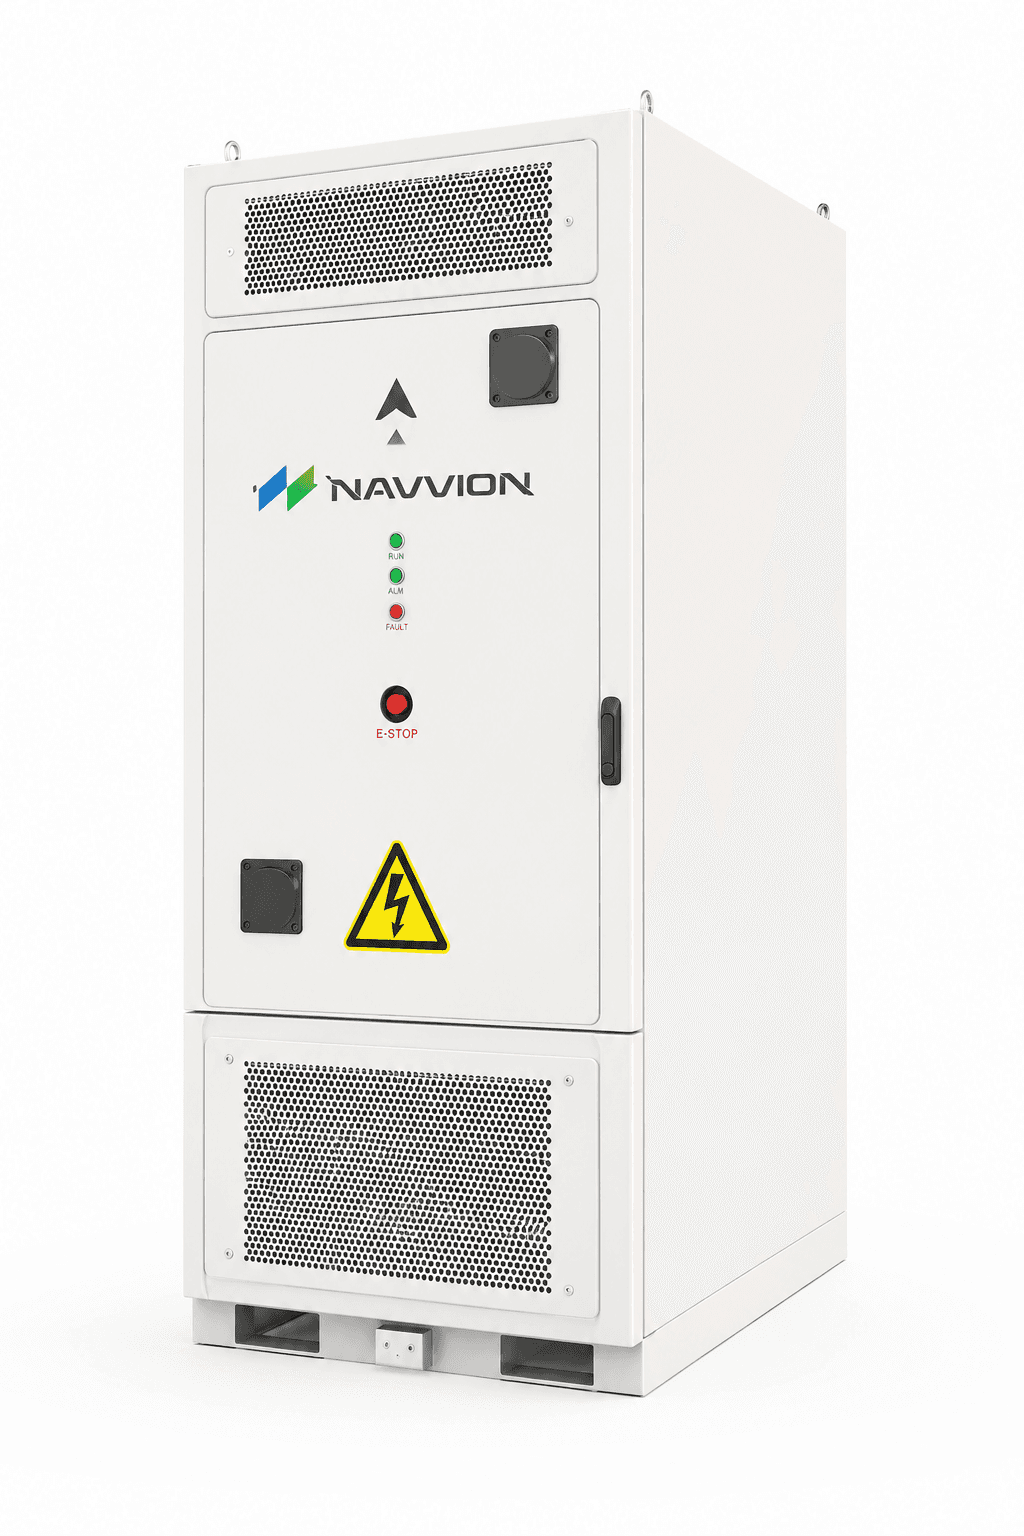
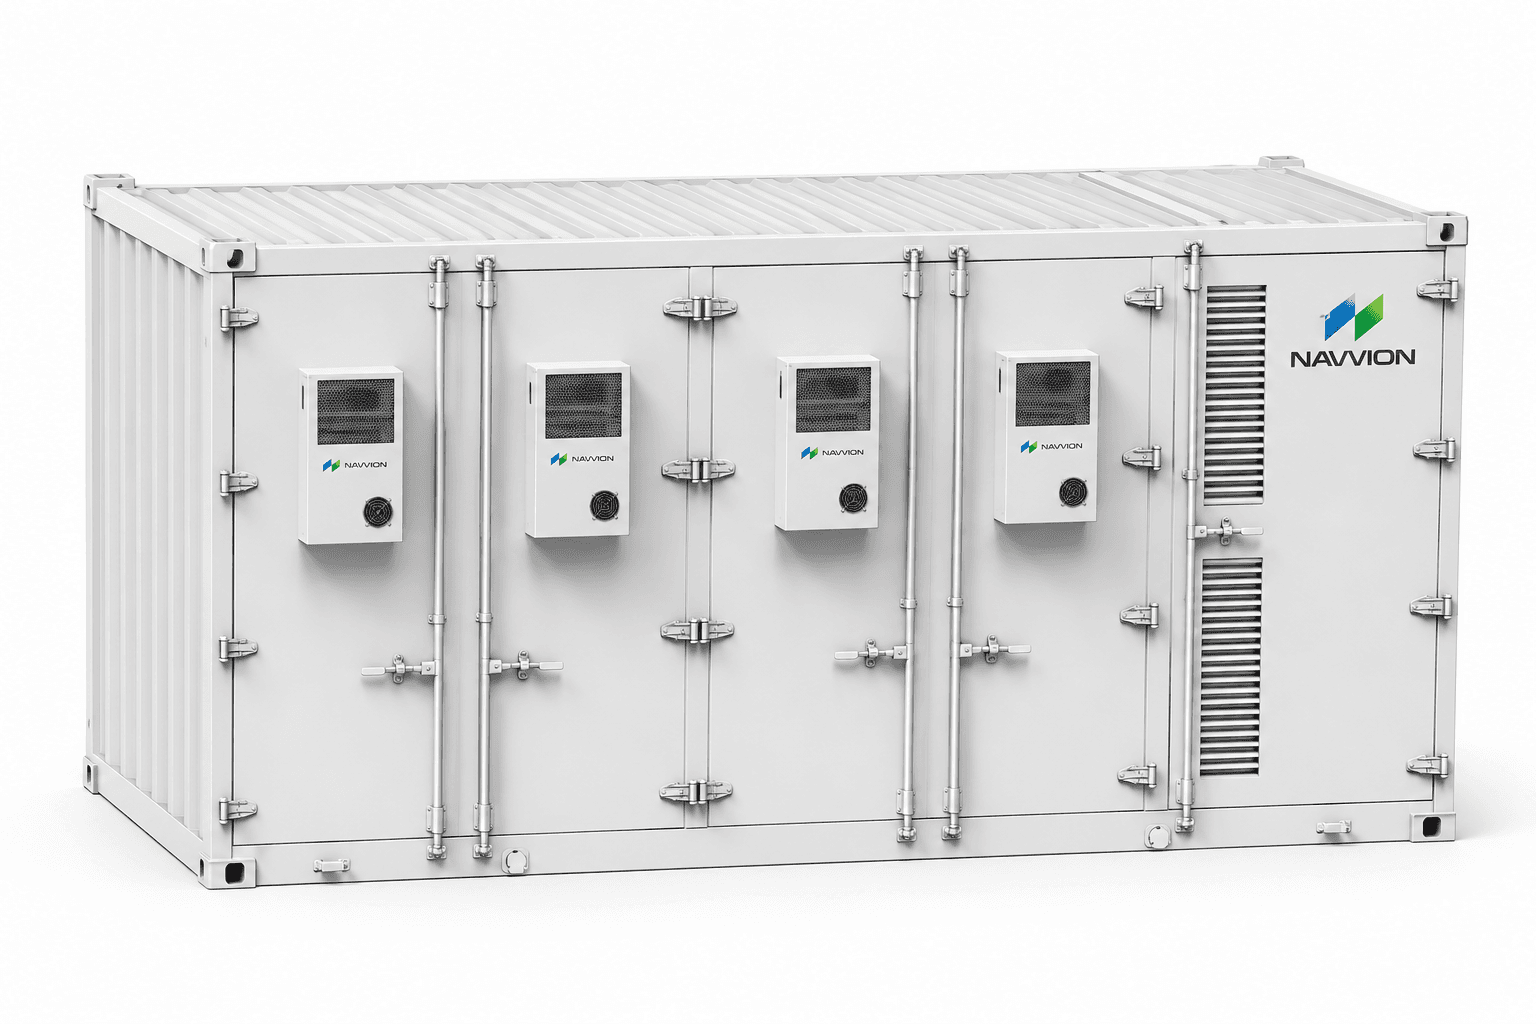
The Navvion Alpha and Navvion Beta cabinets cover the building-block sizes most demand-charge sites need; a 2 MWh containerized Navvion Zeta scales the same architecture for larger facilities.

- System sizing
- Financial modeling
- Installer coordination
- Commissioning
- APM onboarding
- After-sales service
Economics
What the payback looks like.
| Battery size | 500 kWh / 250 kW |
| Installed cost | $420 / kWh |
| Incentive / tax credit | 10% of CAPEX |
| Demand charge | $20 / kW-mo |
| Monthly peak reduction | 200 kW |
| Energy shifting | 1 cycle/day @ $0.05/kWh |
| Net installed cost | $189,000 |
| Demand-charge savings | $48,000 / yr |
| Energy-shifting savings | $9,125 / yr |
| Simple payback | 3.3 years |
| 20-year net return | $953,500 |
Illustrative scenario using the default assumptions from our ROI calculator. We model real savings against your actual tariff and load profile.
Run your numbersFAQ
Common questions.
How much can our demand charges actually drop?
It depends on how short and predictable your peaks are. We model the achievable reduction from 12 months of interval data before proposing any hardware — never from averages.
What if the battery is empty when a peak hits?
The EMS reserves a state-of-charge floor for forecasted peak windows and dispatches against the forecast, so the system throttles rather than exhausts.
Does this work alongside solar?
Yes. Pairing with PV improves both self-consumption and peak coverage; the same EMS coordinates both assets.
Will demand response or a rate change break the payback?
We model against your current tariff and flag program eligibility up front. Battery value is robust because it targets the peak-setting intervals directly, so it holds up even as rate structures and demand-response programs evolve.
How is billed demand actually measured on our account?
Most C&I tariffs bill the single highest 15–30 minute interval each month, and some apply a ratchet that carries a past peak forward. We read your interval data and model against your specific tariff mechanism rather than a generic assumption.
More Solutions
Explore related applications.
Let's model your project.
Send your load profile through the intake form and we'll respond with a sizing analysis.
What we need to start.
- 12 months of utility bills
- Interval / load data
- Site electrical drawings
- Solar generation data, if any
- Backup power requirements
- Available space
- Interconnection constraints